
How to create an employee attendance tracker and dashboard in Excel
Quick answer: Build an attendance tracker in Excel with one row per employee and one column per day of the month. Enter a short code in each cell (for example P present, A absent, AL annual leave, SL sick leave, WFH work from home, H holiday). Use COUNTIF to total each code per employee, conditional formatting to colour codes, and NETWORKDAYS.INTL with weekend code 1 for the UAE Saturday–Sunday weekend to calculate working days. For late arrivals and overtime, keep a separate time log with clock-in and clock-out times and compare them with shift times. Summarise everything on a dashboard sheet.
Many small UAE businesses do not need expensive HR software for attendance. A well-built Excel tracker handles 5 to 100 employees comfortably, and it gives you the data you need for payroll, leave balances and conversations about punctuality.
Step 1: Decide your attendance codes
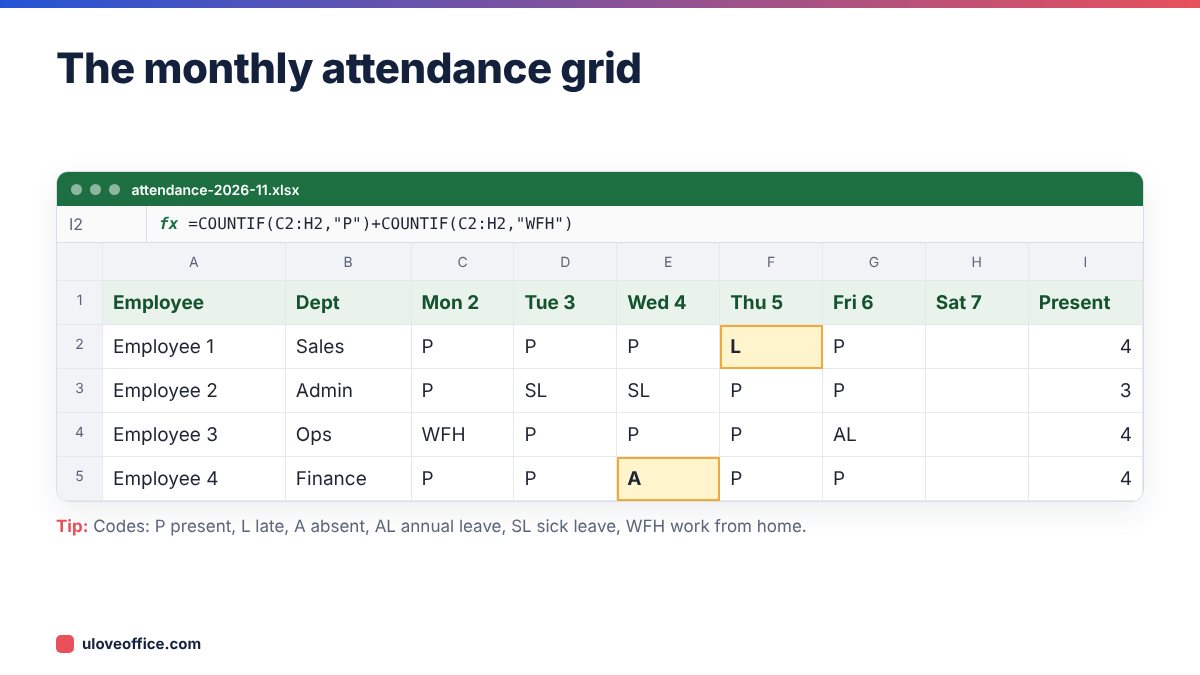
Agree a short list of codes and do not let people invent new ones. A typical set:
- P = present, on time
- L = present, late
- A = absent without approval
- AL = annual leave
- SL = sick leave
- UL = unpaid leave
- WFH = work from home
- H = public holiday
- OFF = weekend or rest day
Put the codes in a small table on a Settings sheet with a description for each. Then use Data Validation > List on the grid, pointing to the code list, so people can only choose valid codes from a drop-down. Our guide on creating a drop-down list in Excel shows how.
Step 2: Build the monthly grid
- On a sheet named for the month, put Employee in A1 and Department in B1.
- In C1, enter the first date of the month. In D1, enter
=C1+1and copy across for the rest of the month. - Format the dates to show the day name and number: custom format
ddd d. - List employees in column A, one per row.
To grey out weekend columns automatically, select the grid and add a conditional formatting rule using a formula:
=WEEKDAY(C$1,2)>5
This marks Saturdays and Sundays (the UAE federal weekend). If your company works Saturdays, change the rule to =WEEKDAY(C$1,2)=7 for Sundays only.
Step 3: Colour the codes
Add conditional formatting rules so the grid is readable at a glance:
- A in red
- L in amber
- SL and UL in light purple
- AL in light blue
- WFH in light green
Use Home > Conditional Formatting > Highlight Cells Rules > Text that Contains, or “Equal to” for exact matches.
Step 4: Add summary columns
After the last day column, add summary columns for each employee:
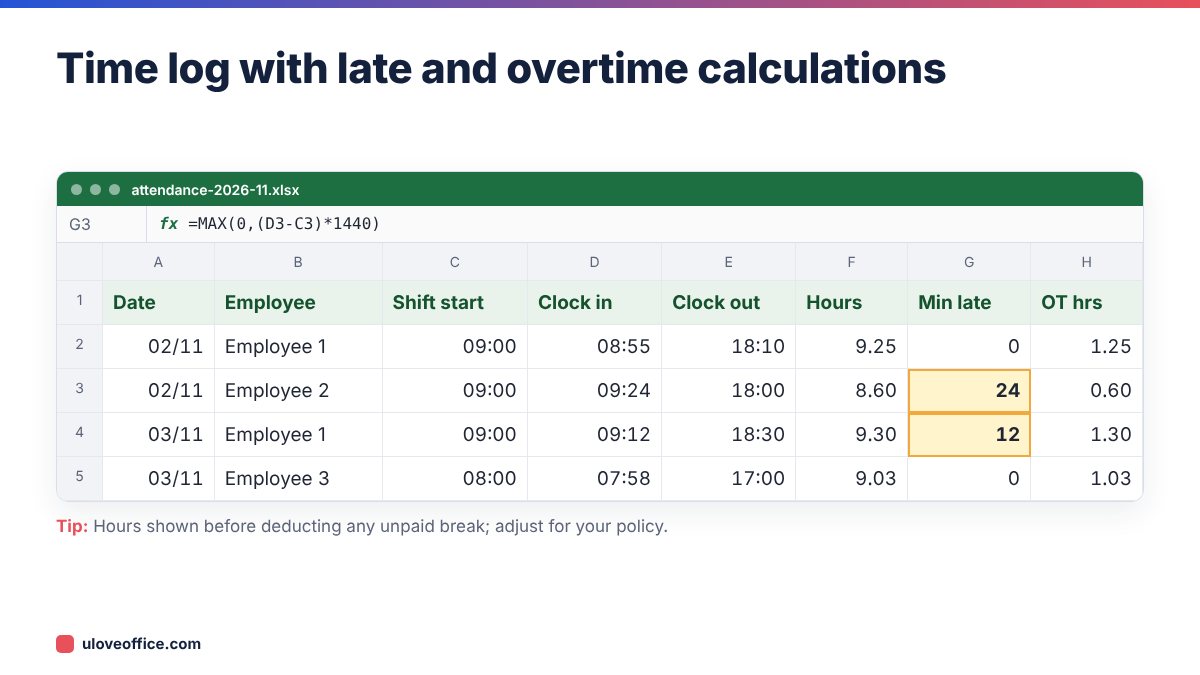
- Present:
=COUNTIF(C2:AF2,"P")+COUNTIF(C2:AF2,"L")+COUNTIF(C2:AF2,"WFH") - Late:
=COUNTIF(C2:AF2,"L") - Absent:
=COUNTIF(C2:AF2,"A") - Annual leave:
=COUNTIF(C2:AF2,"AL") - Sick leave:
=COUNTIF(C2:AF2,"SL") - Working days in month:
=NETWORKDAYS.INTL($C$1, EOMONTH($C$1,0), 1, Holidays[Date]) - Attendance %:
=Present / WorkingDays
Adjust AF to the last day column of the month. Keep a named holiday table as explained in our Excel date formulas guide.
Step 5: Track late arrivals and overtime with times
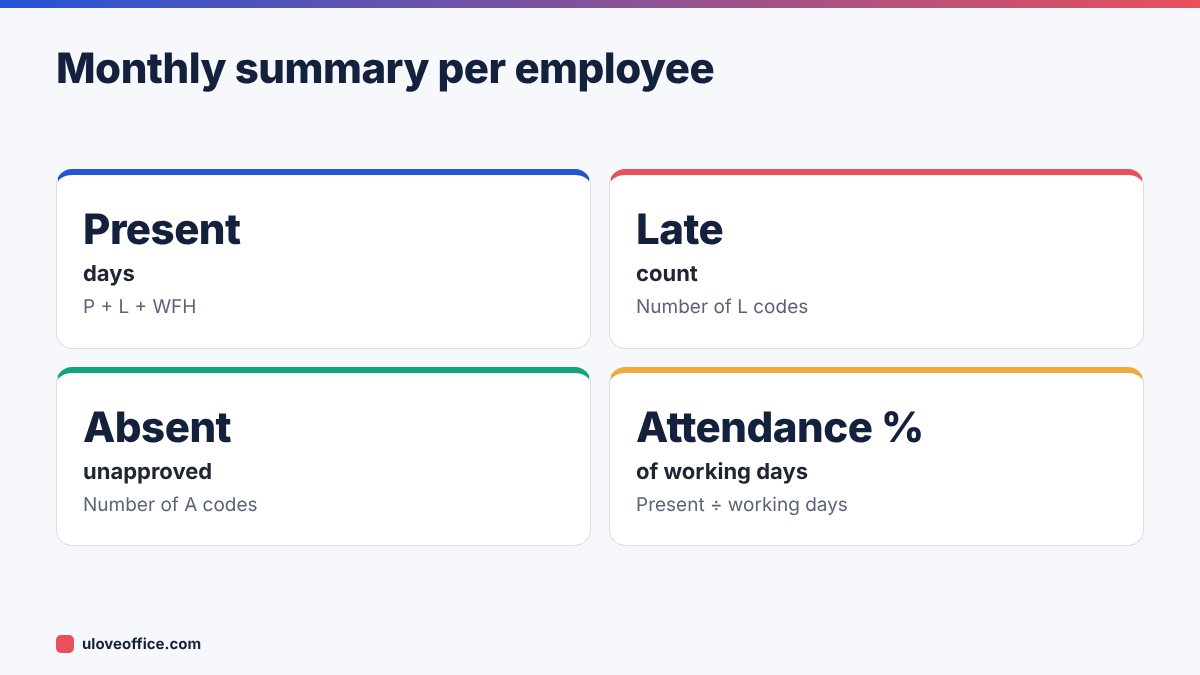
Codes tell you that someone was late, but not by how much. For that, keep a Time Log sheet with one row per employee per day:
| Date | Employee | Shift start | Clock in | Shift end | Clock out |
|---|---|---|---|---|---|
Then add:
- Minutes late:
=MAX(0, (D2-C2)*1440) - Late flag:
=IF(G2>10,"Late","")(with a 10-minute grace period, or your policy) - Hours worked:
=(F2-D2)*24(subtract an unpaid break if your policy has one) - Overtime hours:
=MAX(0, H2-8)for an eight-hour day
The UAE Labour Law sets normal working hours at up to eight per day and 48 per week, with overtime paid at a premium: generally 25% extra, and 50% extra for overtime between 10 pm and 4 am, subject to exceptions. Use our Overtime Pay Calculator to check amounts, and see our guide on how to calculate working hours in Excel for more time formulas.
If you use a biometric or card system, export its data monthly and clean it with Power Query instead of typing times. Our Power Query guide shows how.
Step 6: Build a simple dashboard
Create a Dashboard sheet with:
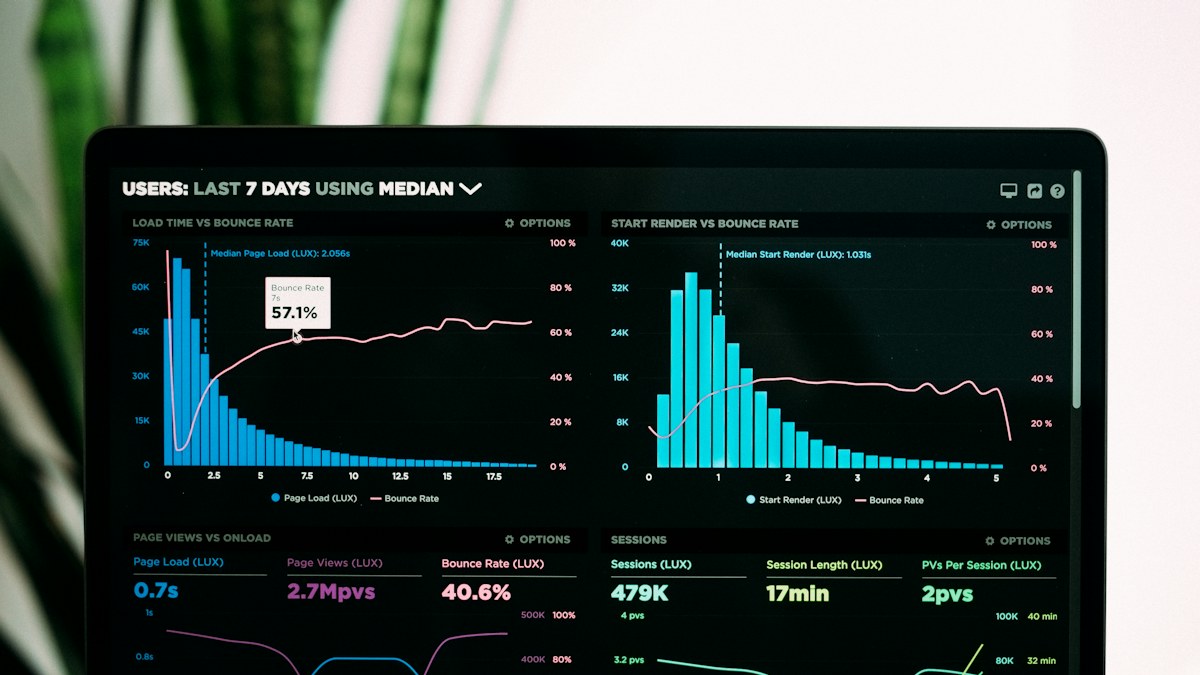
- Company attendance % for the month: average of all employees’ attendance %.
- Top late arrivals: use
SORTBY(Microsoft 365) or a PivotTable to list employees by late count. - Absences by department:
SUMIFSon the Absent column by department. - Leave taken: total AL and SL days.
- A chart of attendance % by department.
Add a month selector with a drop-down if you keep each month on a separate sheet, and use INDIRECT or, better, combine monthly sheets into one table with Power Query and use a PivotTable with a slicer. Our guide on creating an Excel dashboard covers layout.
Linking attendance to leave and payroll
- Feed AL totals into your leave balance sheet so annual leave balances update monthly.
- Use UL days for unpaid leave deductions in payroll.
- Check SL against the UAE sick leave rules, under which pay changes after the initial period of full pay. Our guide on UAE sick leave rules explains the pay calculation.
- Send overtime hours to payroll with approvals attached.
Privacy and fairness
Attendance data is personal data. Keep the workbook in a restricted folder, give managers access only to their own teams where possible, and use attendance data consistently for everyone. Before discussing lateness with an employee, check the data is accurate, especially if it came from a machine export.
Monthly routine for the attendance owner
Give one person ownership of the tracker and a simple routine:
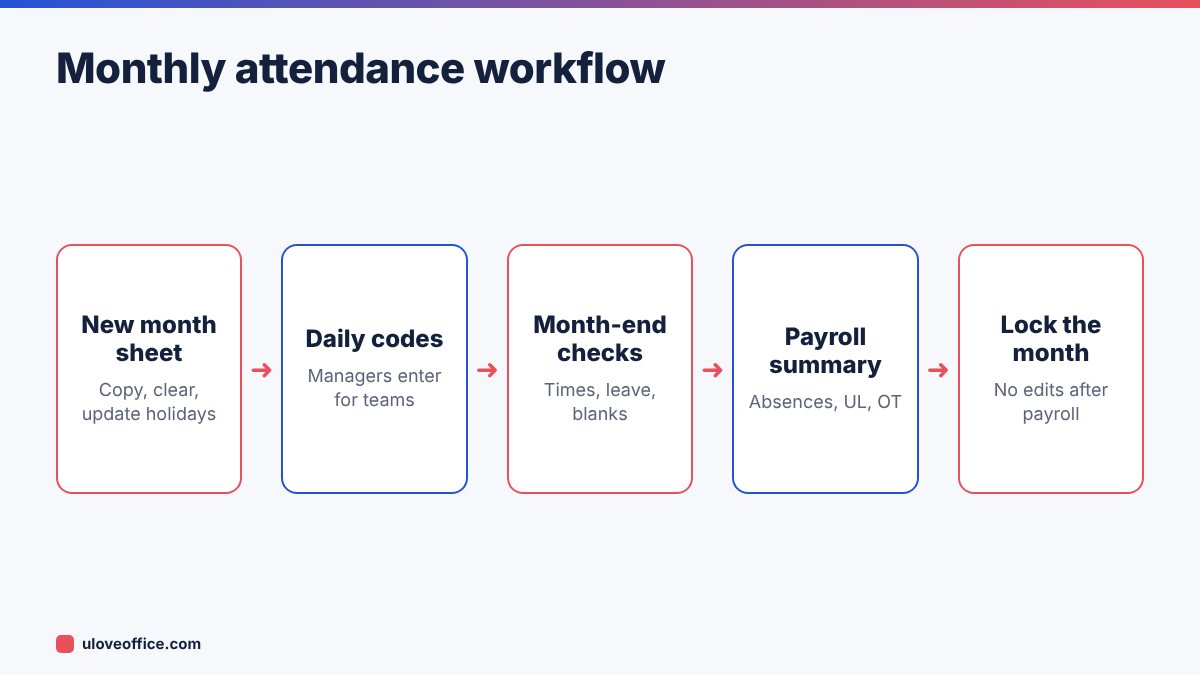
- Before the month starts: copy last month’s sheet, clear the codes, update the start date and check the holiday table includes any announced public holidays.
- Daily or weekly: managers or the receptionist enter codes for their teams. Late arrivals are marked the same day while memories are fresh.
- Month end: import machine times if you use a biometric system, reconcile codes against approved leave requests, and resolve any blanks.
- Payroll handover: send absent days, unpaid leave, sick leave and approved overtime to payroll in one summary.
- Lock the month: protect the sheet so codes cannot be changed after payroll.
The routine takes about an hour at month end for a 30-person company, and much less once managers are used to entering codes daily, and it removes most attendance disputes, because data is entered once, checked once and then fixed.
Worked example: spotting a pattern
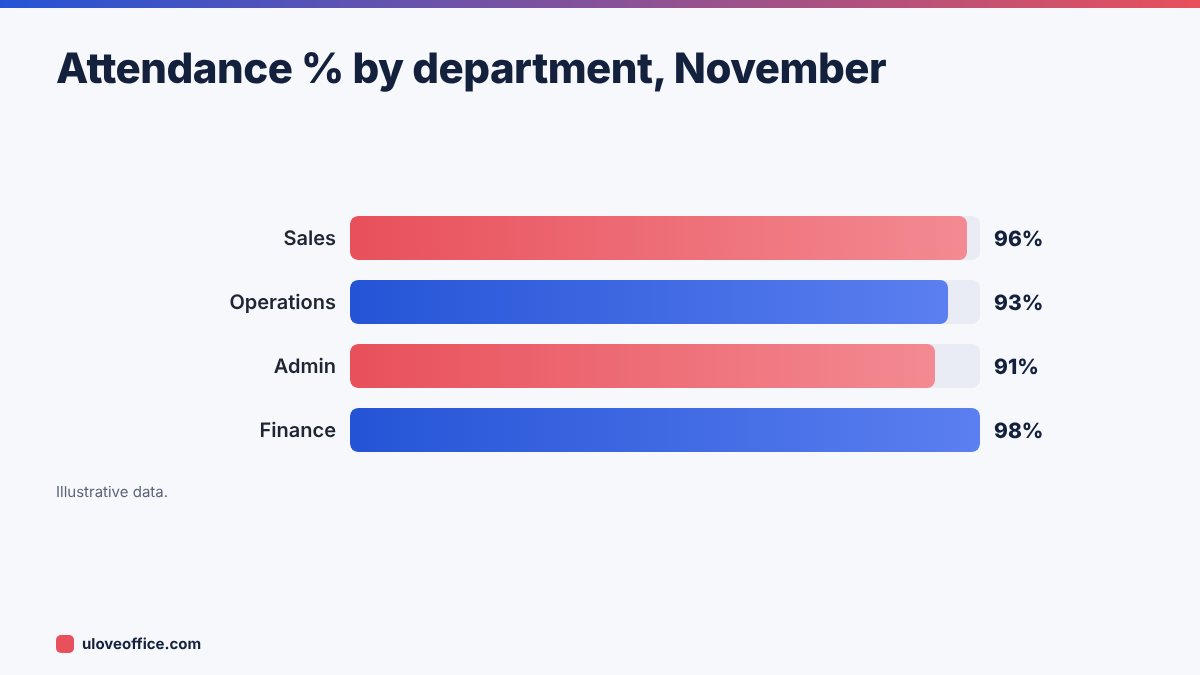
In a 30-person trading company, the dashboard showed that Operations had 93% attendance in November, below the company average of 96%. Filtering the time log showed that most late arrivals in Operations were on Mondays and Thursdays, all between 9:10 and 9:25. A conversation revealed the shift start had been moved to 9:00 while a staff bus still arrived at 9:15. The company moved the Operations shift to 9:15 to 6:15. Late arrivals dropped by more than half the next month. Without the data, the issue would have been treated as individual lateness, and several good employees would have received warnings for a problem the company itself had created.
Common mistakes
- Free-text entries like “late 20 min” instead of codes, which breaks counting.
- Text times imported from machines that look like times but are not.
- Forgetting holidays, so attendance % looks too low in months with Eid.
- One giant sheet for the whole year, which becomes slow and error-prone.
- Editing last month after payroll, which creates disputes. Lock completed months.
📘 Continue reading
Frequently asked questions
Can I use Google Sheets instead?
Yes. COUNTIF, NETWORKDAYS.INTL, conditional formatting and data validation all work.
How do I handle half-days?
Use a code like HD and count it as 0.5 in your present formula: +0.5*COUNTIF(range,"HD").
What about Ramadan hours?
Reduced working hours apply in Ramadan. Change the expected hours in your time log for those dates, so overtime is calculated correctly.
How many employees can Excel handle?
Comfortably a few hundred with this design. Beyond that, consider HR software.
Key takeaways
- Fixed codes with a drop-down are the foundation; free text breaks every formula.
- Shade weekends automatically and keep a holiday table so working days are correct.
- Use a separate time log for minutes late and overtime, with real Excel times.
- Summarise with COUNTIF and show results on a simple dashboard by department.
- Lock each month after payroll and restrict access, because attendance is personal data.
- Look for patterns in the data before treating lateness as an individual problem.
Using attendance data in conversations
Numbers start a conversation; they do not end it. Before discussing attendance with an employee, check the data for errors, look for patterns such as the same day each week, and ask open questions about the cause. Transport problems, caring responsibilities or health issues are often behind repeated lateness. Agree clear expectations and any reasonable adjustment, record the conversation briefly, and follow your disciplinary policy only if the issue continues. Our guide to employee warning letters explains the formal steps.
Conclusion
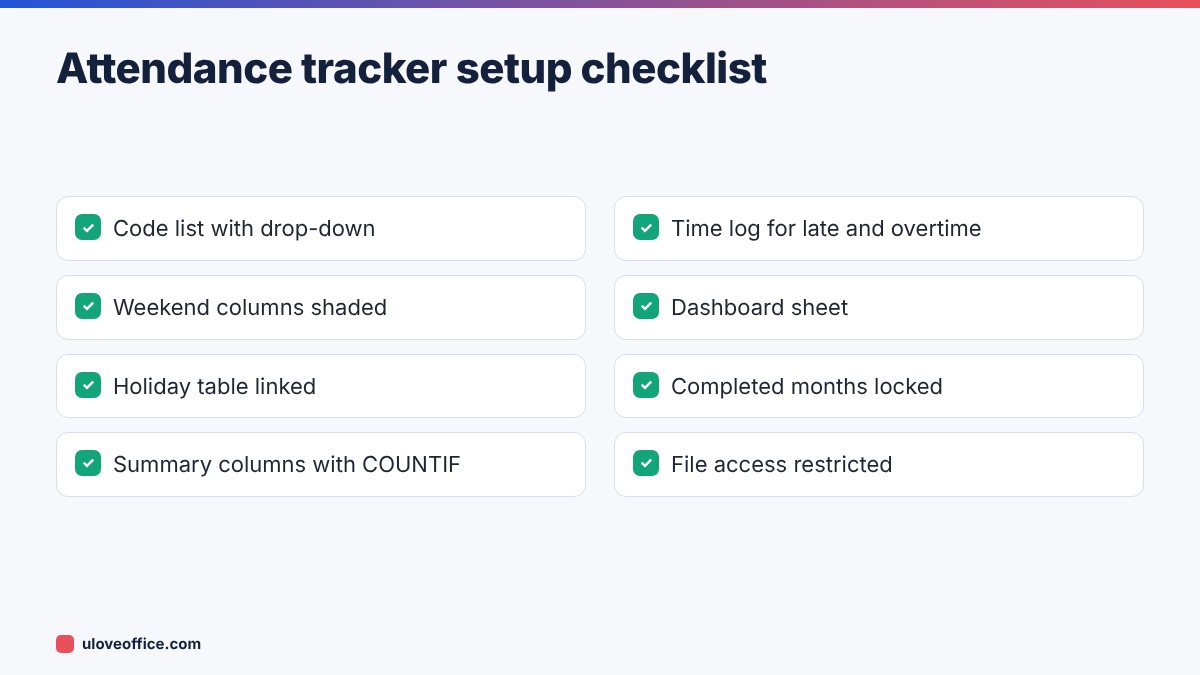
A reliable attendance tracker needs only a few ingredients: fixed codes with a drop-down, a monthly grid with weekends shaded, COUNTIF summaries, NETWORKDAYS.INTL for working days, a time log for late and overtime minutes, and a simple dashboard. Lock each month after payroll, keep the file private, and you will have accurate data for payroll, leave and performance conversations.
Last checked: 9 November 2026.